Target Dashboard
A centralized view of all promoted targets within the system.
The Target Dashboard combines both tabular data and an interactive visualization to support evaluation and prioritization.
📋 Target Table displays a list of targets along with key information such as:
- Associated Genes
- Evidence-based scores (derived from questionnaire responses or curated sources).
- Supports sorting and filtering on high-interest and all targets.
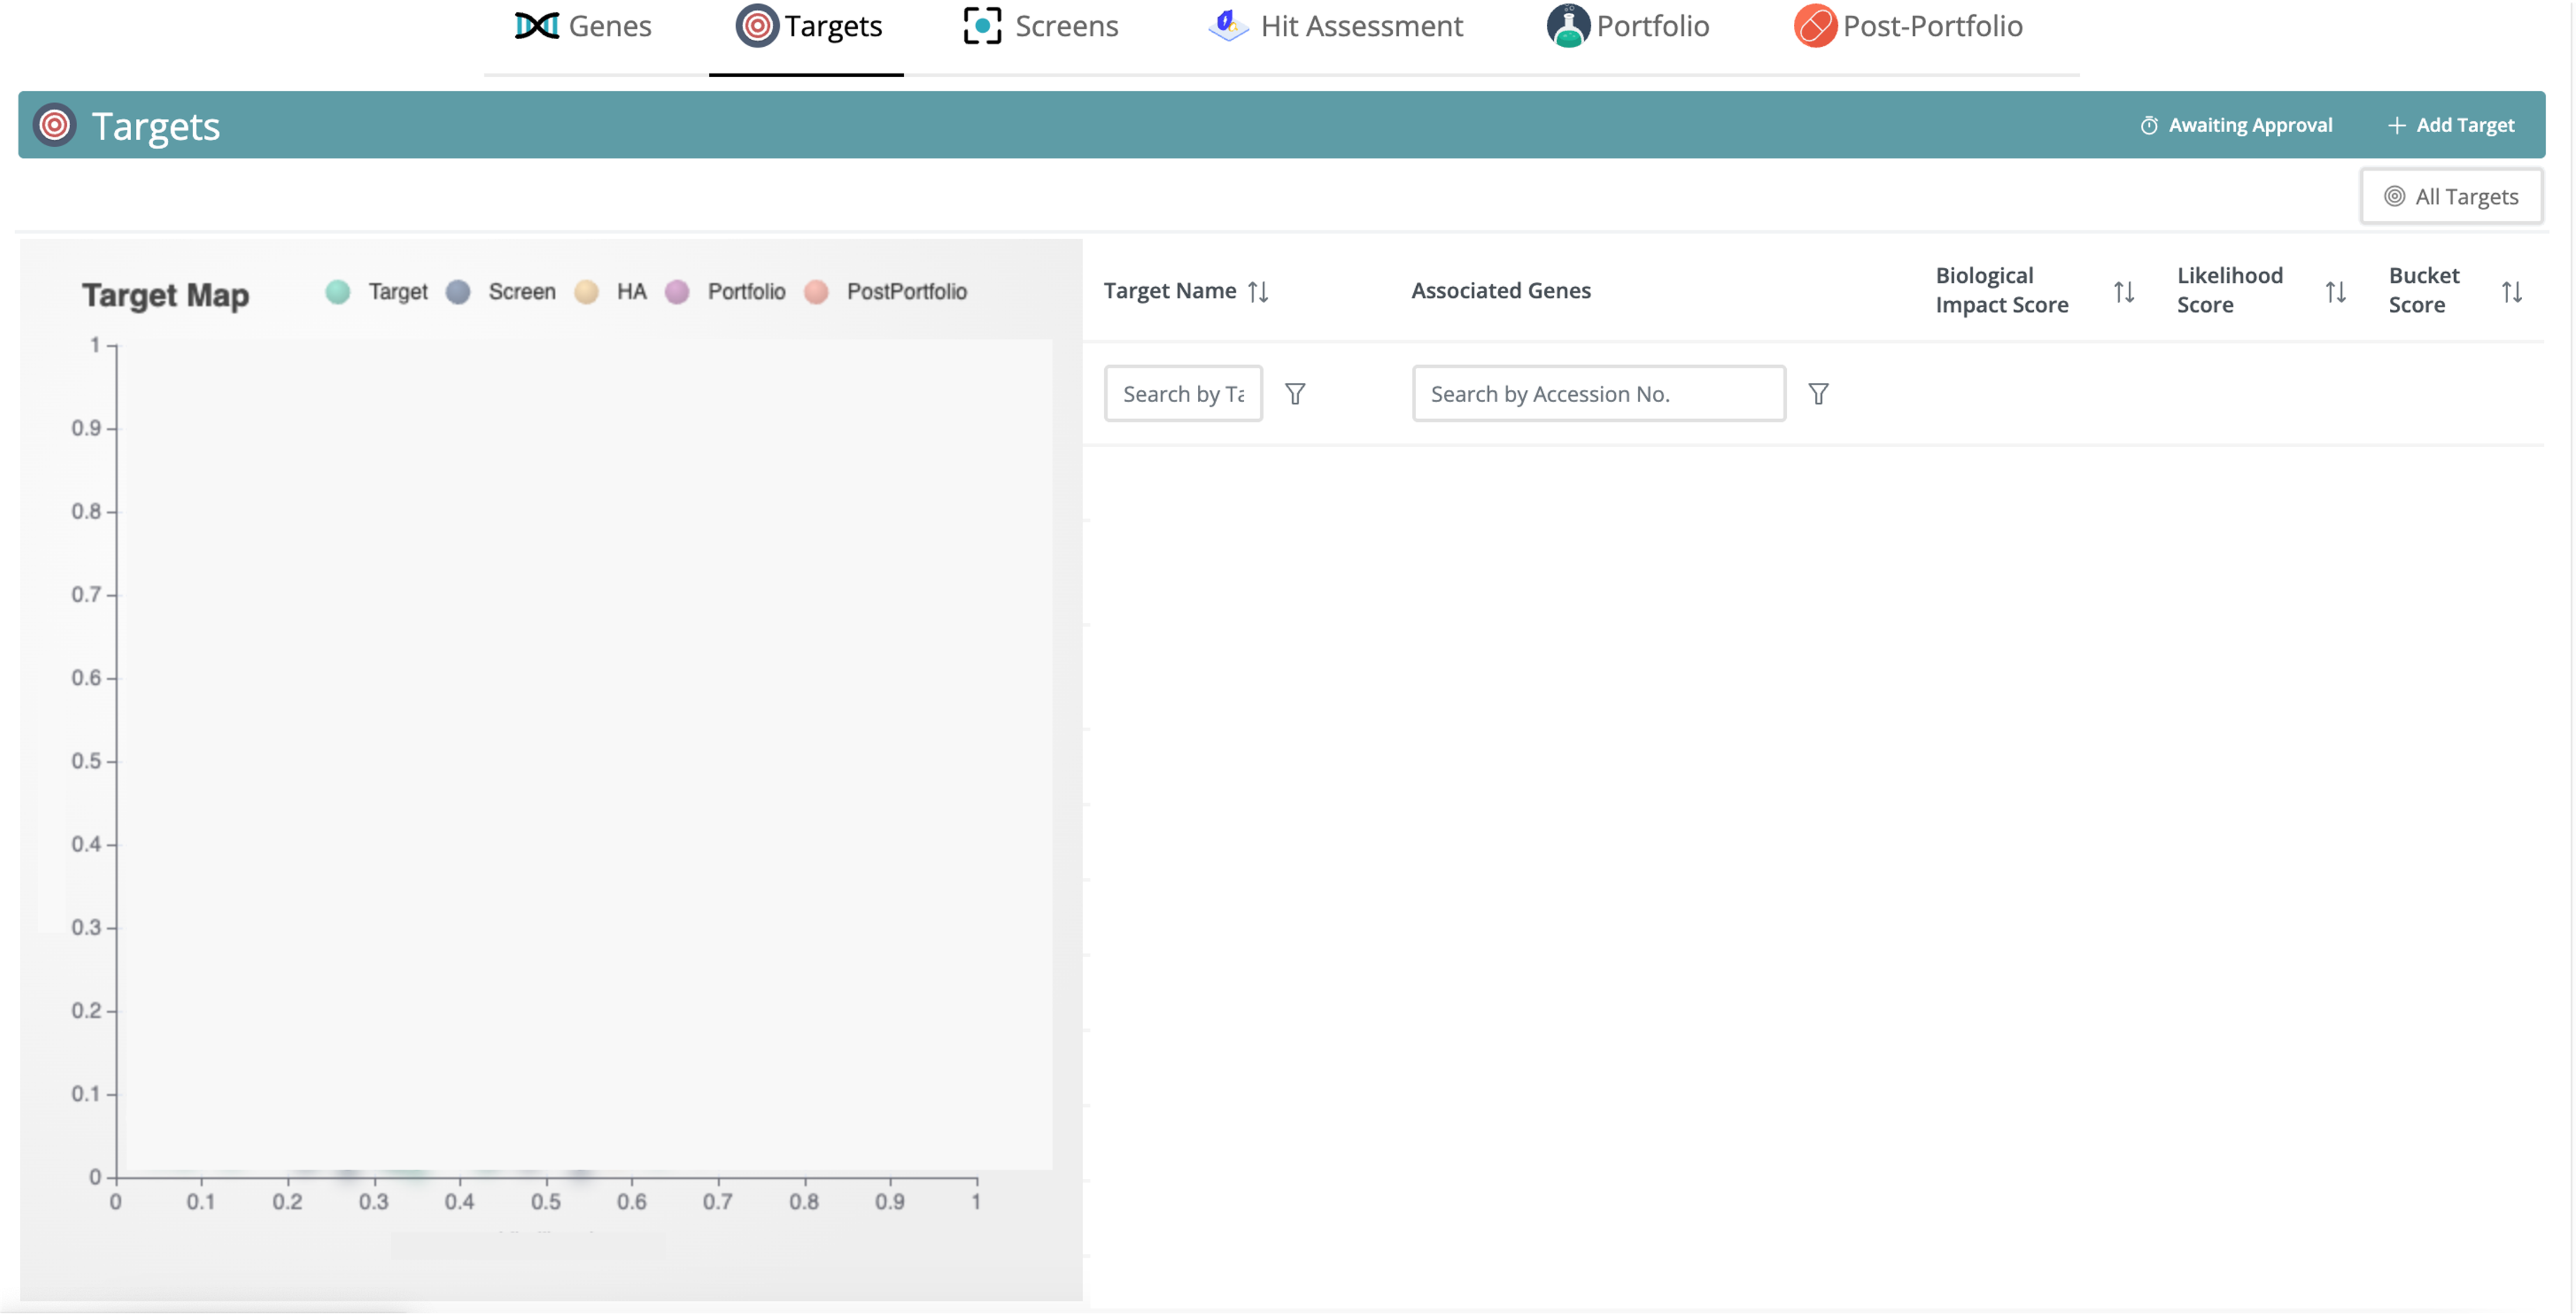
Target map
The target map provides a visual overview of all targets, grouped by their stage in the pipeline. Color or grouping reflects the target’s current stage.- Hover over a stage label to temporarily highlight and filter all targets associated with that stage.
- Click on a dot to directly navigate to the Detail Page for that specific target.
This map supports quick navigation and helps users identify stage-specific priorities across the portfolio.
⚠️ Note: Some data shown in this guide has been masked or anonymized to protect confidential or sensitive project information. The examples are intended for illustrative purposes only.